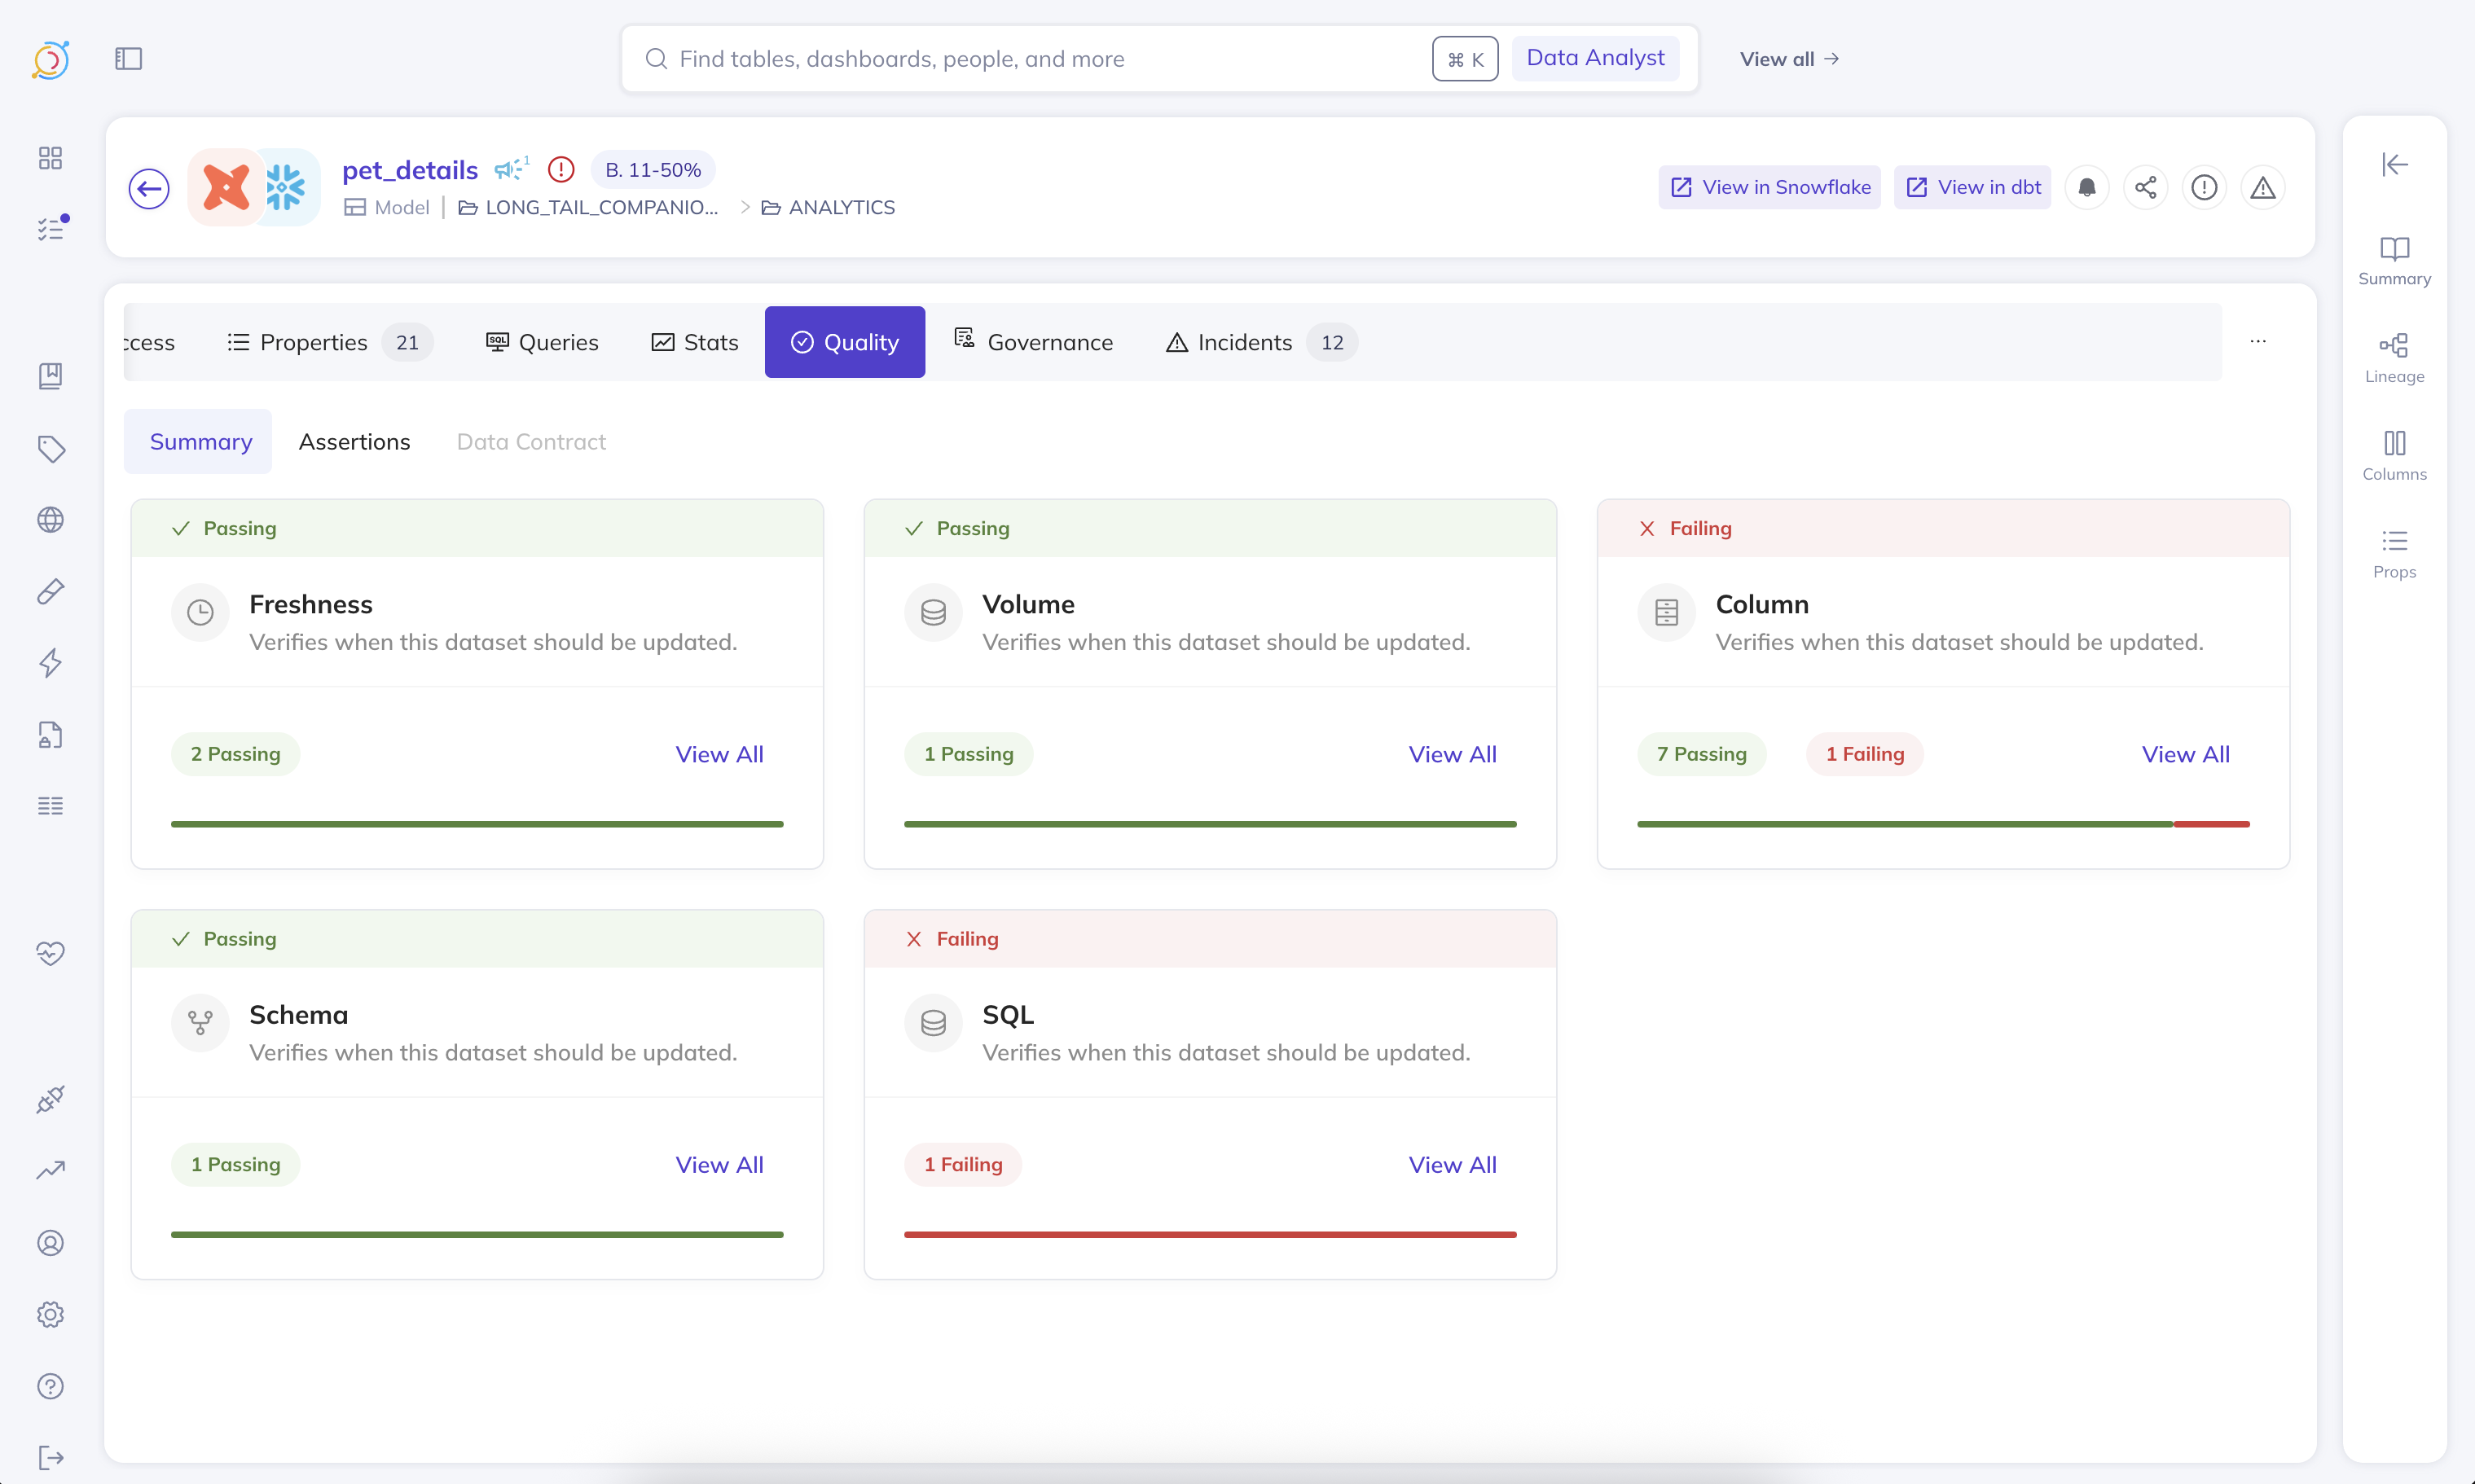
Assertions
An assertion is a data quality test that finds data that violates a specified rule. Assertions serve as the building blocks of Data Contracts – this is how we verify the contract is met.
DataHub Cloud Observe supports assertions on any platform that ingests the required metadata into DataHub. There are two ways an assertion can be evaluated:
- Active query — DataHub Cloud issues a SQL query directly against the source on a schedule. This is available for Snowflake, Redshift, BigQuery, and Databricks.
- Ingestion-driven — DataHub Cloud evaluates the assertion against metadata that ingestion already reports — DataHub Operations, Dataset Profiles, or the ingested schema. Ingestion-driven mode works on any platform, but the relevant aspect must be flowing into DataHub — either via an ingestion source that emits it, or via the DataHub API/SDK. The evaluation cadence is bounded by the cadence at which the underlying aspect is ingested.
Most assertion types support both modes. Custom SQL and Column Value assertions are the exceptions — they require an active warehouse connection.
Capabilities at a glance
Table A — Assertion type × capability
Active query is supported on Snowflake, Redshift, BigQuery, and Databricks. For ingestion-driven assertions, click the aspect link in the table to see which sources emit it.
| Assertion type | What it checks | Active query | Ingestion-driven aspect | Anomaly Detection | Time-series bucketing | Backfill |
|---|---|---|---|---|---|---|
| Freshness | Has the table changed recently? | Audit Log, Information Schema, Last Modified Column, High Watermark Column, File Metadata (Databricks) | Operation | Yes | No | No |
| Volume | Row count is in range / growing as expected | Information Schema, COUNT(*) Query | DatasetProfile | Yes | Yes — Public Beta (Query source only, warehouses only) | Yes — Private Beta (requires bucketing) |
| Column Metric | Aggregate metric (null count, min, mean, …) is in range | Query | DatasetProfile / SchemaFieldProfile | Yes — Public Beta, limited to null_count, unique_count, empty_count, zero_count, negative_count | Yes — Public Beta (FIELD_METRIC only, warehouses only) | Yes — Private Beta (requires bucketing) |
| Column Value | Every row matches a constraint (regex, range, in-set) | Query | Not available | No | No | No |
| Custom SQL | Arbitrary SQL returning a numeric value | Query (always) | Not available | Yes — Public Beta | No | No |
| Schema | Expected columns + types are present | Evaluated on schema-change events against the ingested schema | Ingested schema | No (schema changes are discrete events, not anomalies) | N/A | No |
Table B — Detection mode × where it applies
Ingestion-driven assertions are not platform-restricted — they only require that the underlying aspect is being reported into DataHub. Most DataHub-provided ingestion sources emit the relevant aspects automatically; for sources that don't, you can always emit them yourself via the SDK.
| Detection mode | Powers | Where it works |
|---|---|---|
| Active query | All assertion types, time-series bucketing, backfill | Snowflake, Redshift, BigQuery, Databricks. |
Ingestion sources that emit Operation | Freshness (incl. Anomaly Detection) | Any source that emits the Operation aspect — see the Operations tutorial for the canonical list of ingestion sources, or report Operations directly via the DataHub SDK. |
Ingestion sources that emit DatasetProfile / SchemaFieldProfile | Volume, Column Metric (both incl. Anomaly Detection) | Any source that emits dataset profiles — see the Supported Sources list, or emit profiles yourself via the SDK. |
| Ingested schema | Schema assertions | Any ingested platform — schemas are reported by all standard ingestion sources. |
When running in ingestion-driven mode, the cadence of the assertion is bounded by your ingestion cadence. Assertion results refresh when the underlying Operation, Dataset Profile, or schema is ingested.
How to Create and Run Assertions
Data quality tests (a.k.a. assertions) can be created and run by DataHub Cloud or ingested from a 3rd party tool.
DataHub Cloud Assertions
For DataHub-provided assertion runners, we can deploy an agent in your environment to hit your sources and DataHub. DataHub Cloud Observe offers out-of-the-box evaluation of the following kinds of assertions:
Monitoring Rules — Assertions at Scale
Monitoring Rules let you automatically apply Anomaly Detection monitors and standard Schema assertions across your data landscape. Define a search predicate — such as a DataHub Domain, data platform, or schema — and DataHub will create Freshness and Volume Anomaly Detection monitors, plus Schema assertions, on all matching datasets. As your data landscape evolves, new datasets that match the predicate are automatically covered, and datasets that no longer match have their monitors removed.
You can create and manage Monitoring Rules from the Data Health Dashboard.
To create column metric Anomaly Detection monitors for multiple columns on a single dataset, see the Anomaly Detection section of Column Assertions.
Detecting Anomalies Across Massive Data Landscapes
There are many cases where either you do not have the time to figure out what a good rule for an assertion is, or strict rules simply do not suffice for your data validation needs. Traditional rule-based assertions can become inadequate when dealing with complex data patterns or large-scale operations.
Common Scenarios
Here are some typical situations where manual assertion rules fall short:
Seasonal data patterns - A table whose row count changes exhibit weekly seasonality may need a different set of assertions for each day of the week, making static rules impractical to maintain.
Statistical complexity across large datasets - Figuring out what the expected standard deviation is for each column can be incredibly time consuming and not feasible across hundreds of tables, especially when each table has unique characteristics.
Dynamic data environments - When data patterns evolve over time, manually updating assertion rules becomes a maintenance burden that can lead to false positives or missed anomalies.
AI Anomaly Detection
In these scenarios, you can enable Anomaly Detection on an assertion and let our ML pipeline automatically detect the normal patterns in your data and alert you when anomalies occur. This approach allows for more flexible and adaptive data quality monitoring without the overhead of manual rule maintenance.
Assertions with or without Anomaly Detection can be defined through the DataHub API or the UI.
Time-Series Bucketing & Historical Backfill
For assertions that need to evaluate data at a specific time granularity (e.g., daily or weekly), you can enable time-series bucketing (Public Beta) on Volume and Column Metric assertions. This partitions your data into time buckets using a timestamp column and evaluates each bucket independently. Bucketing always requires an active query.
When Anomaly Detection is enabled with bucketing, you can also configure historical backfill (Private Beta) to immediately populate the assertion's metrics history, so the AI model can start making accurate predictions from day one. See Backfill Assertion History for details.
Reporting from 3rd Party tools
You can integrate 3rd party tools as follows:
If you opt for a 3rd party tool, it will be your responsibility to ensure the assertions are run based on the Data Contract spec stored in DataHub. With 3rd party runners, you can get the Assertion Change events by subscribing to our Kafka topic using the DataHub Actions Framework.
Alerts
Beyond the ability to see the results of the assertion checks (and result history) both on the asset's page in the DataHub UI and via the DataHub API, you can also get notified via Slack messages (DMs or to a team channel) based on your subscription to an assertion run event, or when an incident is raised or resolved. In the future, we'll also provide the ability to subscribe directly to contracts.
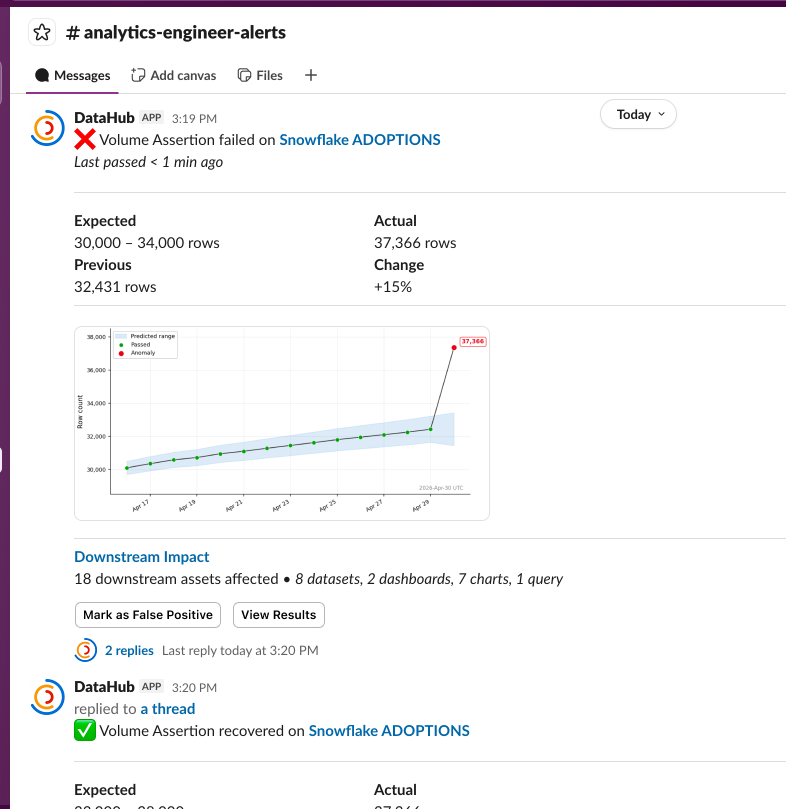
With DataHub Cloud Observe, you can react to the Assertion Run Event by listening to API events via AWS EventBridge or the DataHub Cloud Event Source (the availability and simplicity of setup of each solution dependent on your current DataHub Cloud setup – chat with your DataHub Cloud representative to learn more).
Assertion Failure Severity
To help your team prioritize between assertion failures, the assertion run event carries a severity of LOW, MEDIUM, or HIGH.
Severity can either be assigned automatically by DataHub, or manually controlled by you:
- Automatic: DataHub assigns severity based on the deviation of expected bounds, importance of asset, and downstream impact.
- Manual:
- Default: Choose a default severity for any failure, such as treating every failure as
HIGH. - (optional) Severity Rules: For Volume, Custom SQL, and Column assertions, define numeric rules that map observed failed values to a severity. If multiple rules match, DataHub uses the highest matching severity (
HIGHbeforeMEDIUMbeforeLOW); rule order does not override severity priority. If no rule matches, the configured default severity is used. For example, a row-count assertion can treatrow count >= 1000asHIGH,row count >= 800asMEDIUMand otherwise fall back to your default.
- Default: Choose a default severity for any failure, such as treating every failure as
Worth noting:
- Assertions with Anomaly Detection do not support manual severity configuration.
- Third-party or externally evaluated assertions can report an explicit result severity when they report assertion results.
Sifting through the noise & Data Health Reporting
Sometimes alerts can get noisy, and it's hard to sift through slack notifications to figure out what's important. Sometimes you need to figure out which of the tables your team owns actually have data quality checks running on them. The Data Health Dashboard provides a birds-eye view of the health of your data landscape. You can slice and dice the data to find the exact answers you're looking for.
Cost
We provide a plethora of ways to run your assertions, aiming to allow you to use the cheapest possible means to do so and/or the most accurate means to do so, depending on your use case. For example, for Freshness (SLA) assertions, it is relatively cheap to use either their Audit Log or Information Schema as a means to run freshness checks, and we support both of those as well as Last Modified Column, High Watermark Column, and DataHub Operation (see the docs for more details).
Execution details — Where and How
DataHub Cloud assertions can draw their signal from either of two broad paths. The right path for a given assertion depends on the trade-off between cost, latency, and platform coverage.
Active query (Snowflake / Redshift / BigQuery / Databricks only) — DataHub Cloud issues a query against the source on a schedule:
Information Schematables power cheap, fast checks on a table's freshness or row count.Audit logorOperation logtables can be used to granularly monitor table operations.- The table itself can also be queried directly. This is useful for freshness checks referencing
last_updatedcolumns, row count checks targeting a subset of the data, and column value checks. We offer several optimizations to reduce query costs for these checks.
Active query is low-latency and schedule-driven, but it consumes warehouse compute and is only available on the four supported warehouses. Active query is also required for Custom SQL, Column Value, time-series bucketing, and historical backfill.
Ingestion-driven (any ingested platform) — DataHub Cloud evaluates the assertion against metadata that ingestion already reports:
Operationsreported via ingestion or the DataHub SDK power monitoring of table freshness.DatasetProfileandSchemaFieldProfilereported via ingestion or the SDK power monitoring of table-level and column-level metrics.- Ingested schemas power Schema assertions.
Ingestion-driven assertions incur no warehouse cost beyond what ingestion already pays. Their evaluation cadence is bounded by the cadence at which the underlying aspect is ingested.
Privacy: Execute In-Network, avoid exposing data externally
As a part of DataHub Cloud, we offer a Remote Executor deployment model. If this model is used, assertions will execute within your network, and only the results will be sent back to DataHub Cloud. Neither your actual credentials, nor your source data will leave your network.
Source system selection
Assertions will execute queries using the same source system that was used to initially ingest the table.
There are some scenarios where customers may have multiple ingestion sources for, i.e. a BigQuery table. In this case, by default the executor will take the ingestion source that was used to ingest the table's DatasetProperties. This behavior can be modified by your customer success rep.